Build Admin Dashboard with V0, Next.js, and Supabase — Full Guide
Published: July 1, 2026 • Written by Alex Rivera • Read Time: 15 min • Word Count: 2,130 words
1. Introduction: The Speed of Modern Prototyping
In the fast-paced software landscape of 2026, the time-to-market for a Software-as-a-Service (SaaS) product is a critical factor in its success. Founders, indie hackers, and product teams can no longer afford to spend months manually designing layouts, writing boilerplate API routes, and configuring database schemas from scratch.
To accelerate development, we have adopted powerful AI-native tools that automate the most time-consuming aspects of frontend and backend construction.
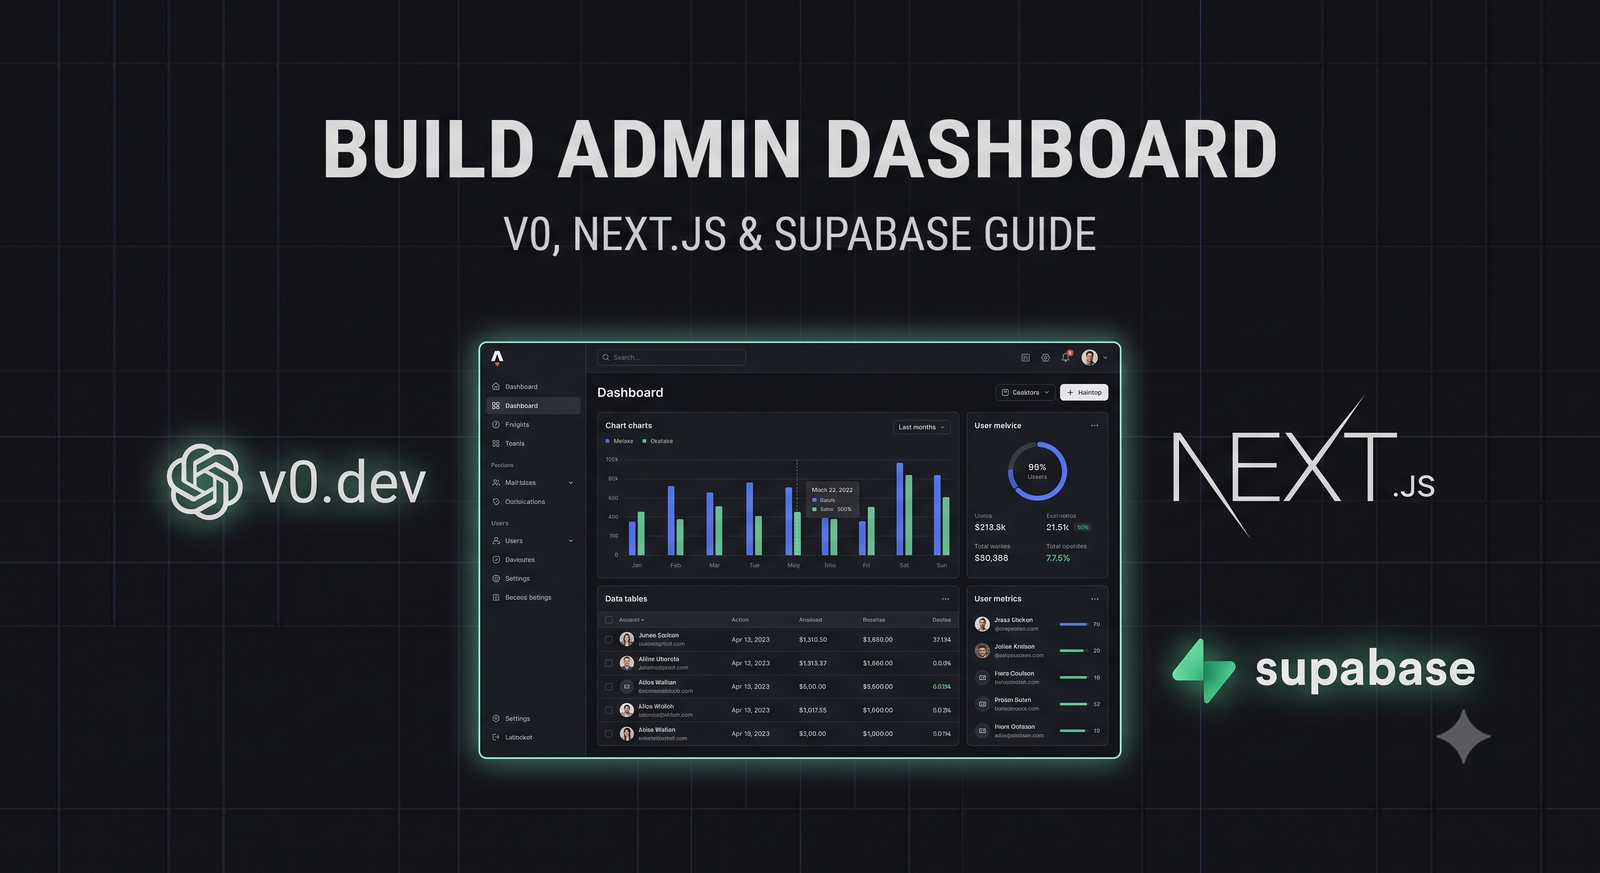
By combining Vercel's **v0.dev** (a state-of-the-art generative UI system) with **Next.js App Router** and **Supabase**, developers can design, build, connect, and deploy complete, production-grade admin dashboards in a single afternoon.
In this comprehensive, step-by-step tutorial, we will walk through building a secure, real-time admin dashboard. You will learn how to generate beautiful, accessible UI components using v0, integrate them into a Next.js application, connect them to a Supabase PostgreSQL database, and render live data charts.
2. The Modern Dashboard Stack: Why It Wins
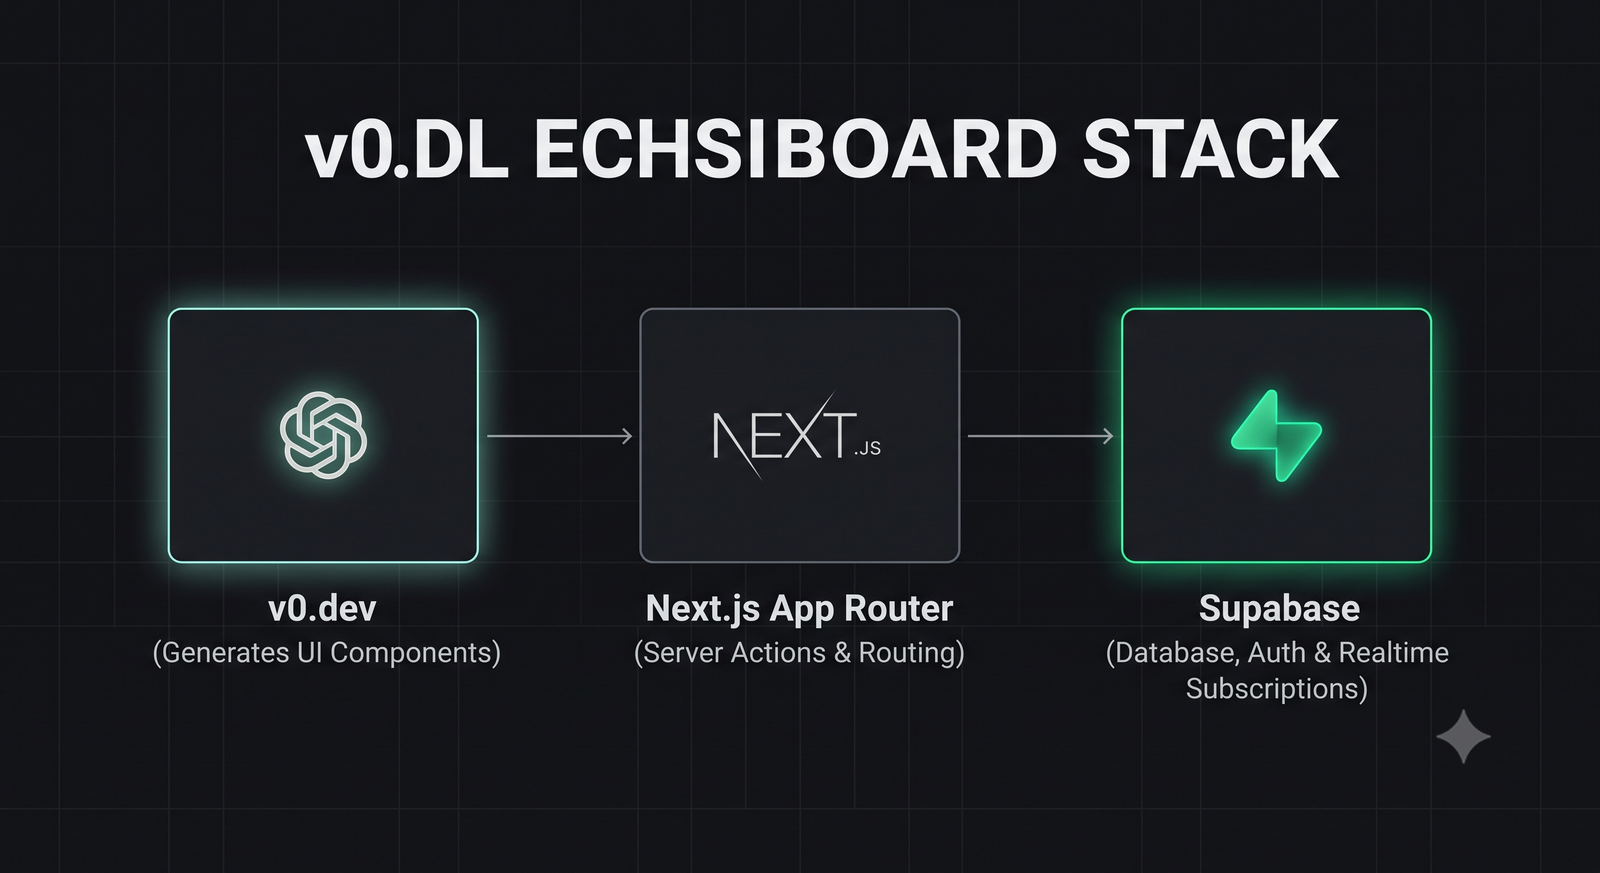
Each component of our chosen stack is selected for its performance, developer velocity, and production stability:
- v0.dev: Generates highly polished, responsive React components styled with Tailwind CSS and fully accessible via Shadcn UI and Radix Primitives.
- Next.js (App Router): Provides a robust, full-stack framework with Server Components for fast data fetching, Server Actions for secure database mutations, and file-based routing.
- Supabase: Delivers a complete, serverless backend including a PostgreSQL database, user authentication, and real-time websocket subscriptions.
3. Prototyping Layouts with v0.dev
To begin, we use **v0.dev** to generate our dashboard's visual layout. Instead of writing hundreds of lines of Tailwind utility classes, we describe our desired interface in natural language.
Open v0.dev and enter the following highly descriptive prompt:
v0 will generate a complete, beautiful React component utilizing Tailwind CSS and Shadcn UI. Copy the generated code; we will integrate it into our Next.js codebase next.
4. Step-by-Step Implementation Guide
Let's bootstrap our Next.js application and integrate our v0-generated components.
Step 1: Initialize Next.js
Run the following command to initialize a new Next.js project with TypeScript and Tailwind CSS:
npx create-next-app@latest my-admin-dashboard --typescript --tailwind --app
Step 2: Initialize Shadcn UI
Initialize Shadcn UI to install the base UI primitives (buttons, dialogs, cards) that our v0 component expects:
npx shadcn-ui@latest init
Step 3: Add the Dashboard Component
Create a file at `components/dashboard-layout.tsx` and paste the React code generated by v0. Ensure you import any required Shadcn components (like `Card`, `Table`, `Badge`) using the shadcn CLI:
npx shadcn-ui@latest add card table badge button
5. Connecting Supabase for Live Data Fetching
Now let's replace our static v0 mock data with live database records fetched from Supabase.
First, ensure you have configured your Supabase server client utility (as detailed in our Supabase Auth Session Fix Guide).
Here is how to fetch transaction records from your Supabase PostgreSQL database inside a Next.js Server Component and stream them directly to your dashboard table:
// app/dashboard/page.tsx
import { createClient } from '@/utils/supabase/server';
import { Table, TableBody, TableCell, TableHead, TableHeader, TableRow } from '@/components/ui/table';
import { Badge } from '@/components/ui/badge';

export default async function Dashboard() {
  const supabase = await createClient();

  // Fetch recent transactions from PostgreSQL
  const { data: transactions, error } = await supabase
    .from('transactions')
    .select('*')
    .order('created_at', { ascending: false })
    .limit(10);

  if (error) {
    console.error('Failed to fetch transactions:', error.message);
    return <div>Error loading dashboard data.</div>;
  }

  return (
    <div class="p-6 space-y-6">
      <h2 class="text-2xl font-bold font-mono">Recent Transactions</h2>
      <Table>
        <TableHeader>
          <TableRow>
            <TableHead>Customer</TableHead>
            <TableHead>Amount</TableHead>
            <TableHead>Status</TableHead>
            <TableHead>Date</TableHead>
          </TableRow>
        </TableHeader>
        <TableBody>
          {transactions.map((tx) => (
            <TableRow key={tx.id}>
              <TableCell>{tx.customer_name}</TableCell>
              <TableCell>${tx.amount.toFixed(2)}</TableCell>
              <TableCell>
                <Badge variant={tx.status === 'completed' ? 'success' : 'warning'}>
                  {tx.status}
                </Badge>
              </TableCell>
              <TableCell>{new Date(tx.created_at).toLocaleDateString()}</TableCell>
            </TableRow>
          ))}
        </TableBody>
      </Table>
    </div>
  );
}
6. Rendering Real-Time Analytics Charts
An admin dashboard is incomplete without interactive analytics charts. In 2026, **Recharts** remains the premier charting library for React and Tailwind CSS due to its declarative syntax and responsive scaling.
Let's install Recharts and build a responsive revenue analytics chart:
npm install recharts
Create a client component at `components/revenue-chart.tsx` to render the interactive chart:
'use client';

import { ResponsiveContainer, AreaChart, Area, XAxis, YAxis, Tooltip } from 'recharts';

interface ChartData {
  month: string;
  revenue: number;
}

export const RevenueChart = ({ data }: { data: ChartData[] }) => {
  return (
    <div class="h-[300px] w-full bg-zinc-900/40 border border-zinc-800 p-6 rounded-xl">
      <h3 class="text-sm font-mono font-bold uppercase tracking-wider text-zinc-400 mb-4">Revenue Overview</h3>
      <ResponsiveContainer width="100%" height="100%">
        <AreaChart data={data}>
          <defs>
            <linearGradient id="colorRevenue" x1="0" y1="0" x2="0" y2="1">
              <stop offset="5%" stopColor="#6366f1" stopOpacity={0.3}/>
              <stop offset="95%" stopColor="#6366f1" stopOpacity={0}/>
            </linearGradient>
          </defs>
          <XAxis dataKey="month" stroke="#71717a" fontSize={12} tickLine={false} axisLine={false} />
          <YAxis stroke="#71717a" fontSize={12} tickLine={false} axisLine={false} />
          <Tooltip contentStyle={{ backgroundColor: '#09090b', borderColor: '#27272a' }} />
          <Area type="monotone" dataKey="revenue" stroke="#6366f1" strokeWidth={2} fillOpacity={1} fill="url(#colorRevenue)" />
        </AreaChart>
      </ResponsiveContainer>
    </div>
  );
};
7. Security & Row Level Security (RLS)
Because admin dashboards display sensitive financial and user records, securing your database is paramount.
Never rely solely on client-side route protection. You **must** enable **Row Level Security (RLS)** on your Supabase tables and write policies that restrict read/write access to users with the `admin` role:
-- Enable RLS on the transactions table
ALTER TABLE transactions ENABLE ROW LEVEL SECURITY;

-- Create policy allowing only authenticated admins to read transactions
CREATE POLICY "Allow admin read access"
ON transactions
FOR SELECT
TO authenticated
USING (
  auth.jwt() ->> 'role' = 'admin'
);
8. Conclusion: Rapid Full-Stack Engineering
The combination of v0.dev, Next.js, and Supabase represents the pinnacle of modern full-stack developer velocity. By leveraging AI to generate accessible, responsive UI layouts, and connecting them to a serverless PostgreSQL database, developers can transition from concept to production in record time.
By adopting these modern prototyping tools and securing your database layers with strict RLS policies, you can build beautiful, high-performance dashboards that scale predictably to support your business growth.
To test your dashboard's API endpoints and inspect HTTP status codes, launch our interactive HTTP Status Code Lookup Tool, or read our guide on Supabase Auth Session Fixes to secure your serverless database connections.

About the Author: Alex Rivera
Founder & Editor-in-Chief, The Byte 404
Alex is a former Senior Systems Architect at Netflix and Stripe with over 15 years of experience building high-throughput distributed APIs. He writes about distributed systems, backend performance, and AI-native engineering workflows.